Bugs found in Piktochart SaaS: QAwerk Bug Crawl
Piktochart is a graphic design platform helping brands deliver visually appealing content. With Piktochart, one can create beautiful infographics, on-point presentations, as well as easily digestible reports. Piktochart templates can be customized in a matter of seconds. As easy is extracting brand colors from the logo: simply drag and drop the needed image to save your custom color palette and fonts. On top of that, the platform offers a rich library of graphics, various design components, and industry-specific templates one can use immediately, modify, or source inspiration from. One more essential feature Piktochart offers is translating complex data into a visual story. In a few clicks, one can transform Excel or Google Sheets data into an interactive map or a colorful pie chart that will update automatically should there be any changes in the original files.
We’ve tested many solutions addressing the need to create designs for various content types in a fast and simple way. Piktochart is one of such handy products, which is also super straightforward in use. However, we spotted a couple of issues it may want to improve to make an even better impression on first-time users.
The “Common Questions” link takes the user to a non-existing page
Severity:
Critical
Steps to Reproduce:
- Open the next URL.
- Scroll down to the next section: Common Questions > What happens if I update the data on Google Spreadsheet?
- Find the next sentence: If your visual is published on the web via … , the data will be updated when you refresh the page and click this link: https://create.piktochart.com/output/.
- Pay attention to the next result.
Environment:
Windows 10 x64 Enterprise
Google Chrome Version 87.0.4280.141 (Official Build)
Actual Result:
The user has been redirected to a non-existing page.
Expected Result:
The user is able to browse the page after being successfully redirected to it.
“55” & “56” blog pages are not found
Severity:
Critical
Steps to Reproduce:
- Open the next URL.
- Scroll down to the counter of available blog pages (1, 2 … 55, 56).
- Click page number “55” and return to the /blog again.
- Click page number “56”.
- Pay attention to the next result.
Environment:
Windows 10 x64 Enterprise
Google Chrome Version 87.0.4280.141 (Official Build)
Actual Result:
“55” & “56” blog pages are not found.
Expected Result:
The user is able to browse blog pages “55” and “56”.
Following the link within the Editing Text tutorial results in “Page not found”
Severity:
Critical
Steps to Reproduce:
- Open the next URL.
- Scroll down to the next visible section: Superscript/Subscript.
- Right above the previous section, find the next sentence: You can align your text box with an image or icon with the vertical or horizontal orange alignment guidelines using the instructions found here.
- Click the “here” link text.
- Pay attention to the next result.
Environment:
Windows 10 x64 Enterprise
Google Chrome Version 87.0.4280.141 (Official Build)
Actual Result:
The page requested by the user was not found.
Expected Result:
The user is able to successfully browse the selected page.
Following "Account settings" link within “Terms of Use” results in the 404 error
Severity:
Critical
Steps to Reproduce:
- Open the next URL
- Scroll down to the next section: Cancellations and Refund Policy.
- Within “Requests for cancellation can be done on your Accounts Settings page on Piktochart or contact us here” find the “Account Settings” tab and click it.
- Pay attention to the next result.
Environment:
Windows 10 x64 Enterprise
Google Chrome Version 87.0.4280.141 (Official Build)
Actual Result:
“Account settings” link leads the user to a blank page (404 error).
Expected Result:
The user is able to successfully browse the selected page.
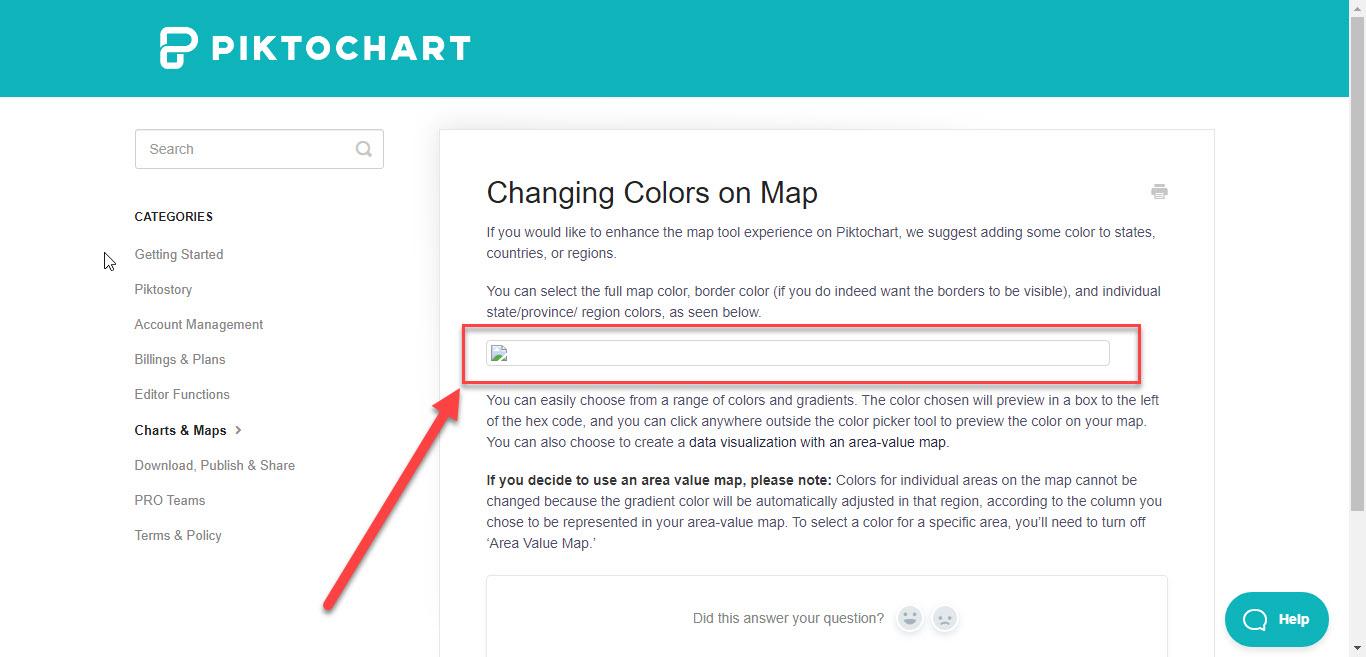
A broken image is shown on the "Changing Color on Map" tutorial page
Severity:
Minor
Steps to Reproduce:
- Open the next URL.
- Wait until the page is fully loaded.
- Pay attention to the next result.
Environment:
Windows 10 x64 Enterprise
Google Chrome Version 87.0.4280.141 (Official Build)
Actual Result:
A broken image is shown on the “Changing Color on Map” tutorial page.
Expected Result:
The image on the “Changing Color on Map” tutorial page is visible.
Creating quality graphics is quite a time-consuming process, yet with Piktochart, it’s easy. No lengthy onboarding tutorials are needed to start turning any text- or data-heavy content into comprehensible and eye-catching reports, presentations, or social media posts. The platform’s core functionality works as intended; I spotted no bugs there. However, I found numerous non-existing pages within the tutorial and terms of use sections, which is understandable considering these are less-visited ones.