No bugs found in New Relic SaaS

New Relic
New Relic is a cloud-based observability platform designed to help businesses monitor, debug, and improve their software.
New Relic offers application performance monitoring for teams to keep an eye on the app’s health in real time. Users can also benefit from browser monitoring, getting insights far beyond page load time. New Relic supports over 500 integrations, including open-source and proprietary monitoring tools.
Our QA engineers manually tested the New Relic platform and were pleasantly surprised by its outstanding quality. Well done!


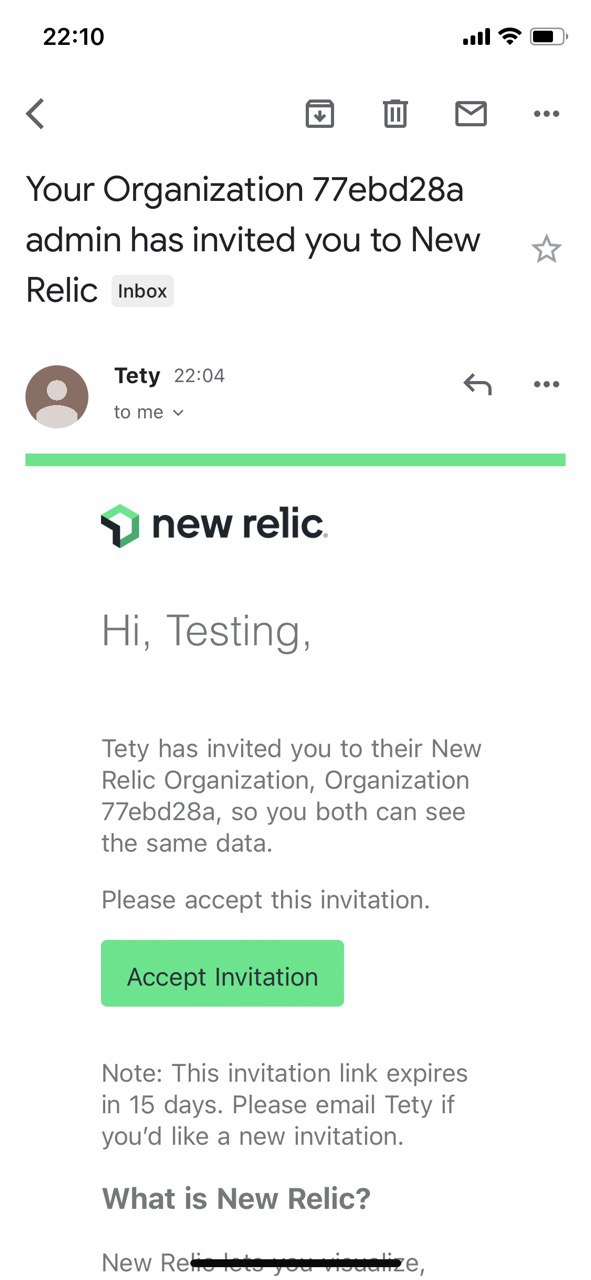
No bugs found after inviting new user to ‘Administration’
The user is registered in the app.
- Navigate to the ‘Administration’ tab in ‘Profile’.
- Switch to the ‘User Management’ tab.
- Click the ‘Add user’ button.
- Enter a name.
- Enter an email.
- Select the type: Basic.
- Click the ‘Add user’ button.
Windows 10
Google Chrome Version 109.0.5414.74
Firefox
Version 109.0.1 4
Microsoft Edge
Version 109.0.1518.78
The new user’s data is displayed in the list with a pending status. The email is sent to the new user’s email address with the ability to accept the invitation.
Bug not found.
No bugs found after enabling discussions feature
The user is registered in the app.
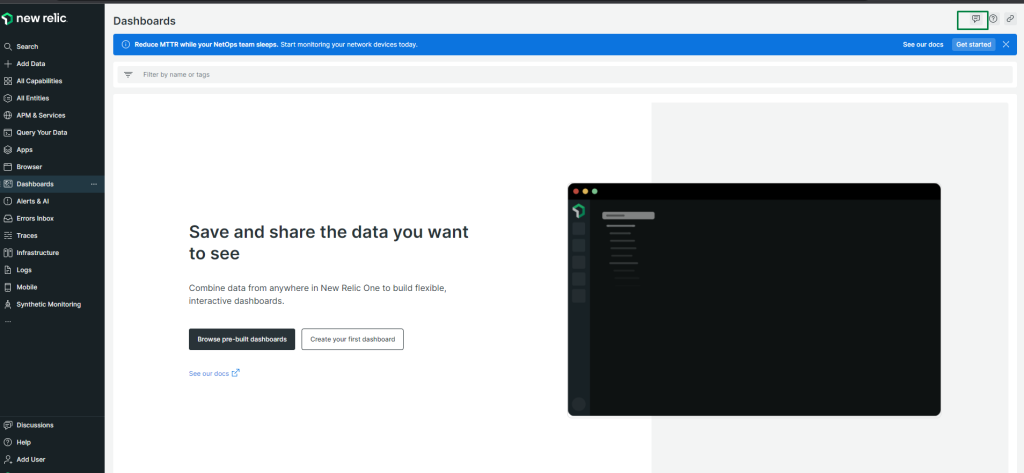
- Click the ‘Discussions’ tab on the left menu bar.
- Click the ‘Enable’ button.
- Click the ‘Accept’ button on the Pre-release software terms.
Windows 10
Google Chrome Version 109.0.5414.74
Firefox
Version 109.0.1 4
Microsoft Edge
Version 109.0.1518.78
The ‘Discussions’ feature has been enabled successfully. There is the ‘Add comment’ button on the right top corner with the ability to have the discussion with teammates.
Bug not found.
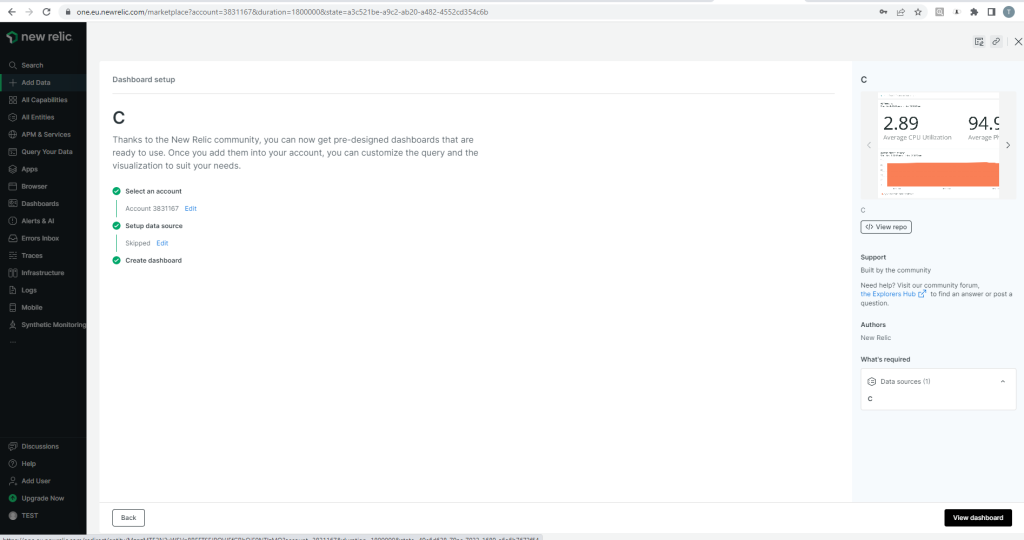
No bugs found after creating pre-built dashboard
The user is registered in the app.
- Navigate to the ‘Dashboards’ tab.
- Click the ‘Create a dashboard’ button.
- Select ‘Browse pre-built dashboards’.
- Select one of the dashboards from the ‘Application Monitoring’ section.
- Select ‘Account’ from the list.
- Skip the setup step.
- Click the ‘Done’ button.
- Click the ‘View Dashboard’ button.
Windows 10
Google Chrome Version 109.0.5414.74
Firefox
Version 109.0.1 4
Microsoft Edge
Version 109.0.1518.78
The pre-built dashboard has been successfully created.
Bug not found.
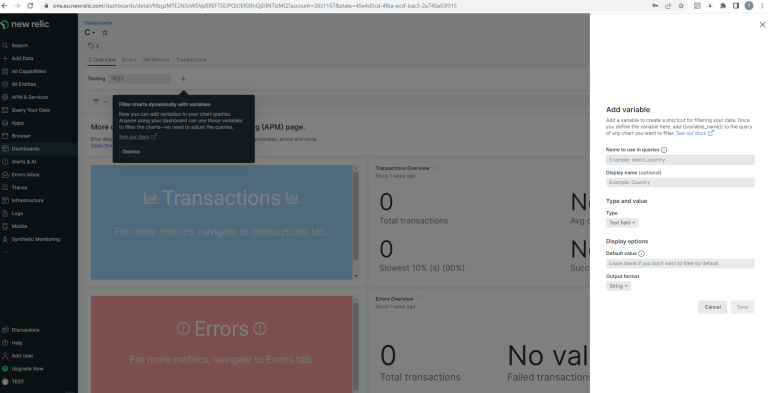
No bugs found after adding new variable to existing dashboard
- The user is registered in the app.
- At least one dashboard has been created by the user.
- Navigate to the existing dashboard.
- Click the ‘Add variable’ button.
- Fill in the ‘Name to use in queries’ field.
- Select the ‘Text’ field type.
- Enter the default value.
- Click the ‘Save’ button.
Windows 10
Google Chrome Version 109.0.5414.74
Firefox
Version 109.0.1 4
Microsoft Edge
Version 109.0.1518.78
The new variable has been successfully added to the dashboard.
Bug not found.
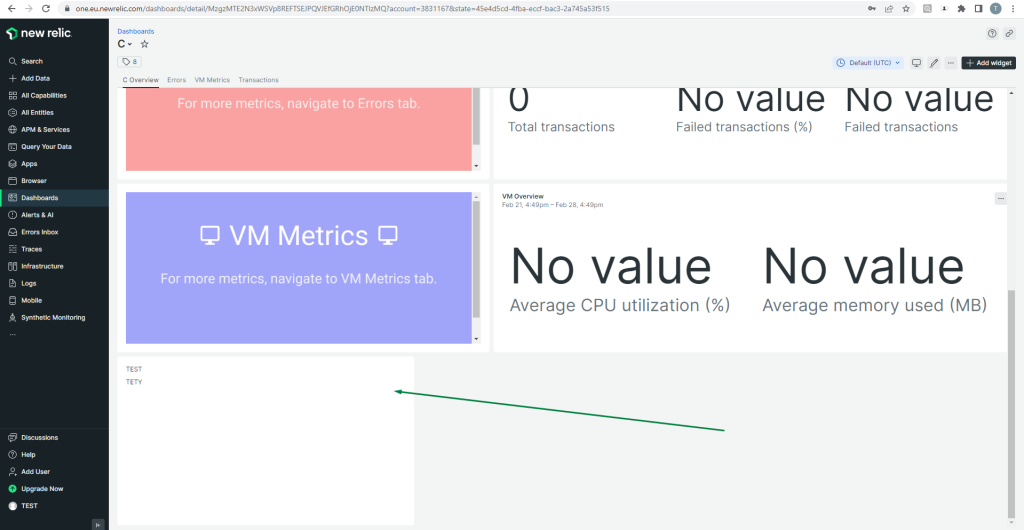
No bugs found after adding additional widget to existing dashboard
- The user is registered in the app.
- At least one dashboard has been created by the user.
- Open the existing dashboard.
- Click the ‘Add widget’ button.
- Select the ‘Add text, images, or links’ option.
- Click the ‘Save’ button.
Windows 10
Google Chrome Version 109.0.5414.74
Firefox
Version 109.0.1 4
Microsoft Edge
Version 109.0.1518.78
A new widget has been successfully added to the dashboard.
Bug not found.
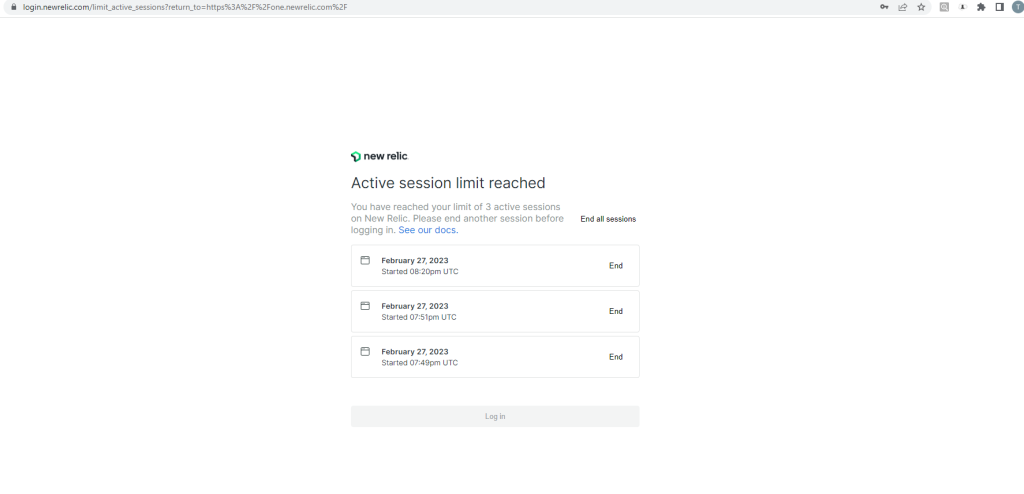
No bugs found after reaching limit of concurrent active sessions
- The user is registered in the app.
- The user has already 2 active sessions.
- Create the 3rd session.
- Check the warning message.
- Click ‘End session’ in any session.
Windows 10
Google Chrome Version 109.0.5414.74
Firefox
Version 109.0.1 4
Microsoft Edge
Version 109.0.1518.78
After reaching 3 concurrent active sessions the following message is displayed: ‘Active session limit reached’; the list of active sessions is displayed.
After clicking the ‘End session’ button on one of the sessions, the user has been logged in successfully.
Bug not found.
No bugs found after checking permissions to view dashboard
- The user is registered in the app.
- At least one dashboard has been created by the user.
- At least one additional user is added to ‘Accounts’.
- Open the existing dashboard.
- Click the ‘Settings’ button.
- Select ‘Edit-everyone’ in the account permissions.
- Save changes.
- Log in as the test user from the list in ‘Accounts’.
- Switch to the ‘Dashboards’ tab.
- Repeat steps 1-6 by selecting ‘Private/View only’ permission.
Windows 10
Google Chrome Version 109.0.5414.74
Firefox
Version 109.0.1 4
Microsoft Edge
Version 109.0.1518.78
The user from ‘Accounts’ can only view the shared dashboard.
Bug not found.
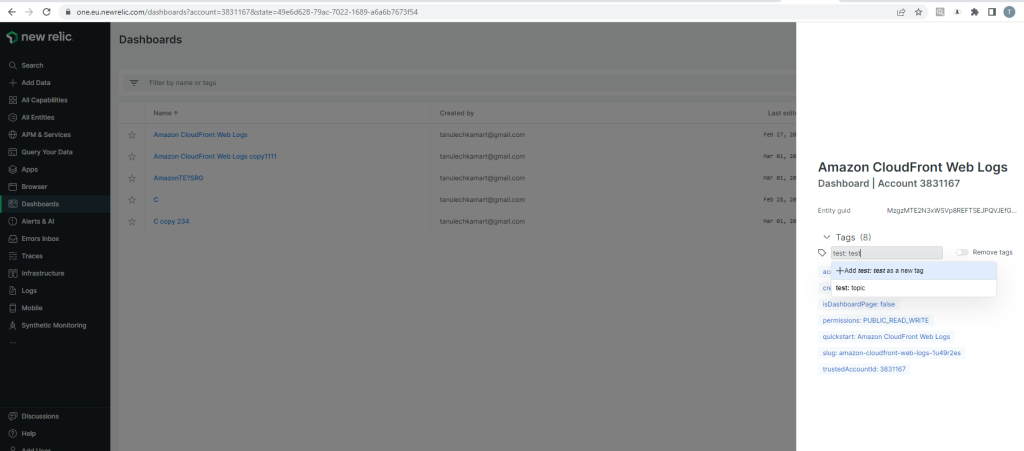
No bugs found after adding tags to existing dashboard
- The user is registered in the app.
- At least one dashboard has been created by the user.
- Switch to the ‘Dashboards’ tab.
- Click ‘Settings’ next to the existing dashboard.
- Select the ‘See metadata & tags’ option.
- Enter a new tag into the input box using the next structure key:value.
- Click the ‘Add’ button.
Windows 10
Google Chrome Version 109.0.5414.74
Firefox
Version 109.0.1 4
Microsoft Edge
Version 109.0.1518.78
A new tag has been created successfully. The tags are sorted alphabetically.
Bug not found.
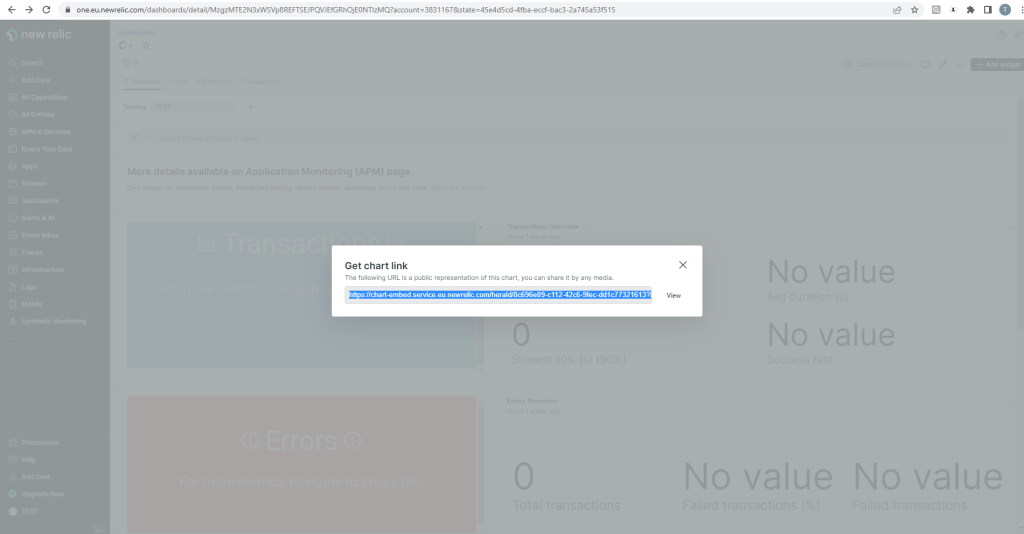
No bugs found after checking ability to get chart link/image from ‘Dashboard’
- The user is registered in the app.
- At least one dashboard has been created by the user.
- Switch to the ‘Dashboards’ tab.
- Click ‘Settings’ on any available widget.
- Click ‘Get as image’.
- Click the ‘Get Chart link’.
- Click the ‘View’ button.
Windows 10
Google Chrome Version 109.0.5414.74
Firefox
Version 109.0.1 4
Microsoft Edge
Version 109.0.1518.78
There is the ability for the user to get the link to the chart or to download the image from the dashboard.
Bug not found.
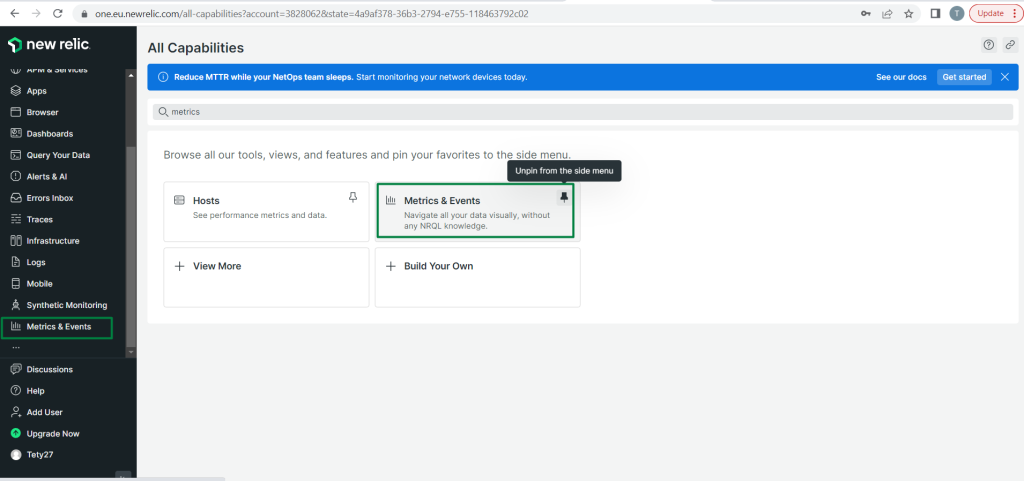
No bugs found after checking ability to pin existing capability to side menu bar
The user is registered in the app.
- Navigate to the ‘All Capabilities’ tab.
- Search for the existing capability, e.g. Metrics.
- Click the pin icon on the ‘Capability’ section.
Windows 10
Google Chrome Version 109.0.5414.74
Firefox
Version 109.0.1 4
Microsoft Edge
Version 109.0.1518.78
The chosen capability has been successfully pinned to the side menu bar.
Bug not found.
The areas I tested contain no bugs, but I'd double-check what permissions are applied to a duplicated dashboard if the parent dashboard's permissions are changed right before this step. Also, when duplicating a dashboard, four more dashboards with /Errors, /Overview, /Transactions, and / VM Metrics appended to the original name appear on the screen but are cleared after the reload.

No Bugs Found!
 We tried to find bugs in this product, but failed to spot any. While we still believe no software is 100% free of bugs, this app contains no critical or apparent defects that could negatively impact the user experience.